Graphical Analysis on Windows Pc
Developed By: Vernier Science Education
License: Free
Rating: 2,0/5 - 343 votes
Last Updated: February 24, 2025
App Details
| Version |
6.1.0 |
| Size |
135.2 MB |
| Release Date |
February 08, 25 |
| Category |
Education Apps |
|
App Permissions:
Allows applications to open network sockets. [see more (7)]
|
|
What's New:
[NEW] Interact directly with the graph axes to change the scaling[NEW] Graph legend visibility improved[NEW] Threshold triggering when remote logging. Requires... [see more]
|
|
Description from Developer:
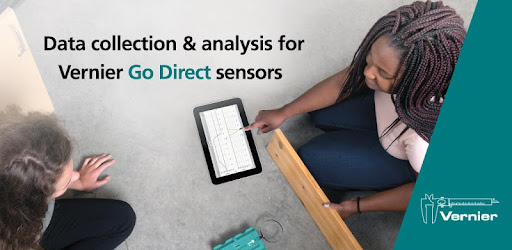
Graphical Analysis™ is a tool for science students to collect, graph, and analyze data from Vernier sensors.
Sensor data-collection support:
• Vernier Go Direct® sensors - with Bl... [read more]
|
About this app
On this page you can download Graphical Analysis and install on Windows PC. Graphical Analysis is free Education app, developed by Vernier Science Education. Latest version of Graphical Analysis is 6.1.0, was released on 2025-02-08 (updated on 2025-02-24). Estimated number of the downloads is more than 100,000. Overall rating of Graphical Analysis is 2,0. Generally most of the top apps on Android Store have rating of 4+. This app had been rated by 343 users, 229 users had rated it 5*, 56 users had rated it 1*.
How to install Graphical Analysis on Windows?
Instruction on how to install Graphical Analysis on Windows 10 Windows 11 PC & Laptop
In this post, I am going to show you how to install Graphical Analysis on Windows PC by using Android App Player such as BlueStacks, LDPlayer, Nox, KOPlayer, ...
Before you start, you will need to download the APK/XAPK installer file, you can find download button on top of this page. Save it to easy-to-find location.
[Note] You can also download older versions of this app on bottom of this page.
Below you will find a detailed step-by-step guide, but I want to give you a fast overview of how it works. All you need is an emulator that will emulate an Android device on your Windows PC and then you can install applications and use it - you see you're playing it on Android, but this runs not on a smartphone or tablet, it runs on a PC.
If this doesn't work on your PC, or you cannot install, comment here and we will help you!
Step By Step Guide To Install Graphical Analysis using BlueStacks
- Download and Install BlueStacks at: https://www.bluestacks.com. The installation procedure is quite simple. After successful installation, open the Bluestacks emulator. It may take some time to load the Bluestacks app initially. Once it is opened, you should be able to see the Home screen of Bluestacks.
- Open the APK/XAPK file: Double-click the APK/XAPK file to launch BlueStacks and install the application. If your APK/XAPK file doesn't automatically open BlueStacks, right-click on it and select Open with... Browse to the BlueStacks. You can also drag-and-drop the APK/XAPK file onto the BlueStacks home screen
- Once installed, click "Graphical Analysis" icon on the home screen to start using, it'll work like a charm :D
[Note 1] For better performance and compatibility, choose BlueStacks 5 Nougat 64-bit read more
[Note 2] about Bluetooth: At the moment, support for Bluetooth is not available on BlueStacks. Hence, apps that require control of Bluetooth may not work on BlueStacks.
How to install Graphical Analysis on Windows PC using NoxPlayer
- Download & Install NoxPlayer at: https://www.bignox.com. The installation is easy to carry out.
- Drag the APK/XAPK file to the NoxPlayer interface and drop it to install
- The installation process will take place quickly. After successful installation, you can find "Graphical Analysis" on the home screen of NoxPlayer, just click to open it.
Discussion
(*) is required
Graphical Analysis™ is a tool for science students to collect, graph, and analyze data from Vernier sensors.
Sensor data-collection support:
• Vernier Go Direct® sensors - with Bluetooth® wireless technology
• Vernier Go Wireless® Heart Rate and Go Wireless Exercise Heart Rate monitors
Additional experiment options:
• Data Sharing via Wi-Fi connection to LabQuest 2, LabQuest 3 or Logger Pro® 3
• Manual Entry
Note: Sensor data collection and Data Sharing require the purchase of hardware from Vernier Software & Technology. Manual entry of data can be performed without a hardware purchase. For more information on Data Sharing, visit http://www.vernier.com/css
Key Features - Data Collection
• Multi-sensor data-collection support
• Time Based, Event Based, and Drop Counting data-collection modes
• Configurable data-collection rate and duration for time-based data collection
• Optional triggering of time-based data collection based on sensor value
• Customizable unit display on supported sensors
• Sensor calibrations
• Option to zero and reverse sensor readings
• Graph match feature for use with motion detectors
• Manual entry of data from keyboard and clipboard
Key Features - Data Analysis
• Display one, two, or three graphs simultaneously
• View data in a table or show a graph and table side-by-side
• Draw Predictions on a graph to uncover misconceptions
• Examine, interpolate/extrapolate, and select data
• Use Tangent tool to show instantaneous rates of change of the data
• Find area under a curve using the Integral tool
• Apply Statistics calculations to find mean, min, max, and standard deviation
• Perform curve fits, including linear, quadratic, natural exponent, and more
• Add calculated columns based on existing data to linearize data or investigate related concepts
Key Features - Collaboration and Sharing
• Create text annotations and add graph titles
• Export graphs and data for printing and inclusion in lab reports
• Save files (.ambl file format) to the Cloud for exchange with Graphical Analysis on other Android™ devices, Chromebooks™, Windows® and macOS® computers, and iOS devices
• Export data in .CSV format for analysis of data in spreadsheet software such as Excel, Google Sheets, and Numbers
• Adjust font sizes for easier viewing when presenting to your class
Vernier Software & Technology has over 35 years of experience in providing effective learning resources for understanding experimental data in science and math classrooms. Graphical Analysis is a part of the extensive system of sensors, interfaces, and data-collection software from Vernier for science and STEM education.
[NEW] Interact directly with the graph axes to change the scaling
[NEW] Graph legend visibility improved
[NEW] Threshold triggering when remote logging. Requires hardware
[FIX] Creating a prediction no longer interferes with analysis
[FIX] Photogate configuration properly restored from a saved file
[FIX] CSV file import stable on all platforms
Allows applications to open network sockets.
Allows applications to access information about networks.
Allows applications to enter Wi-Fi Multicast mode.
Allows applications to access information about Wi-Fi networks.
Allows an application to write to external storage.
Allows an app to access precise location.
Allows an application to read from external storage.